EventID : 19990825_0135
Keyword : Flare
Start : 1999-08-25T01:34:01.000Z
Peak : 1999-08-25T01:35:31.000Z
End : 1999-08-25T01:48:46.000Z
Position: S26E11
X (arcsec) : -177
Y (arcsec) : -535
Maximum Correlation @17GHz (x10^-4) : 1939
Maximum Brightness Temperature @17GHz : 5.1e+07
Area_src/Area_beam @17GHz : 3.6
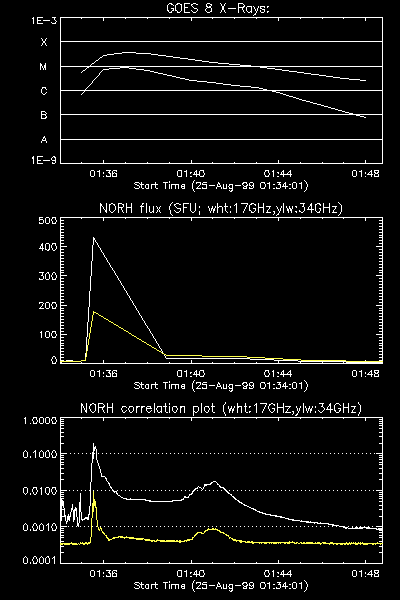
Maximum flux @17GHz (SFU) : 431
Maximum flux @34GHz (SFU) : 179
Number of Impulsive fluctuation : 0
GOES: M3.6
NOAA Number:
Yohkoh HXT (L,M1,M2,H): (213,132,91,60)
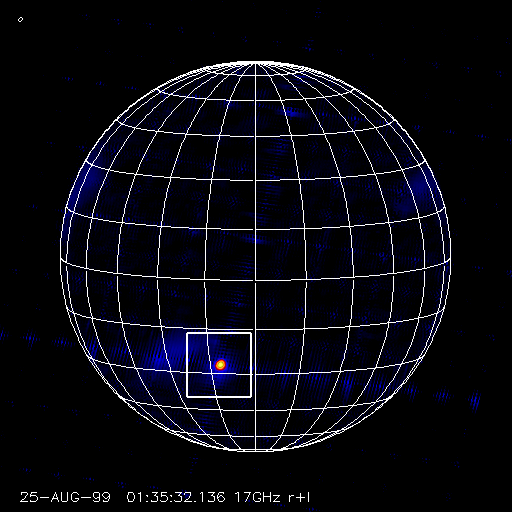
Full sun 17GHz image. The flare region is indicated by the solid box.
movie
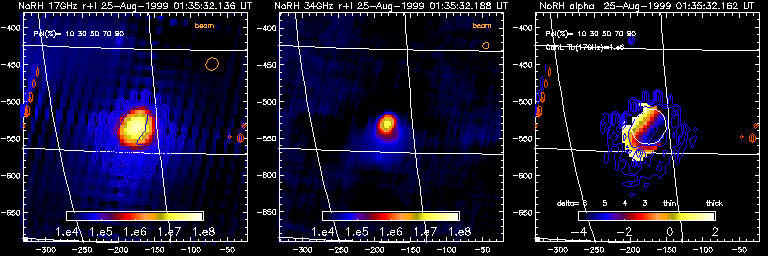
Partial 17/34GHz images. Color map shows brightness temperature,
contour shows 17GHz (r-l)/(r+l) levels,
where 'r' and 'l' indicates right- and
left-handed circularly-polarized components, respectively.
Field of View is 314. x 314. arcsec
Contour levels
of the thick lines are (r-l)/(r+l)=-0.1,-0.2,..
and those of the thin lines are (r-l)/(r+l)= +0.1,+0.2,...
Orange circle at top-left indicates the half-max. beam size
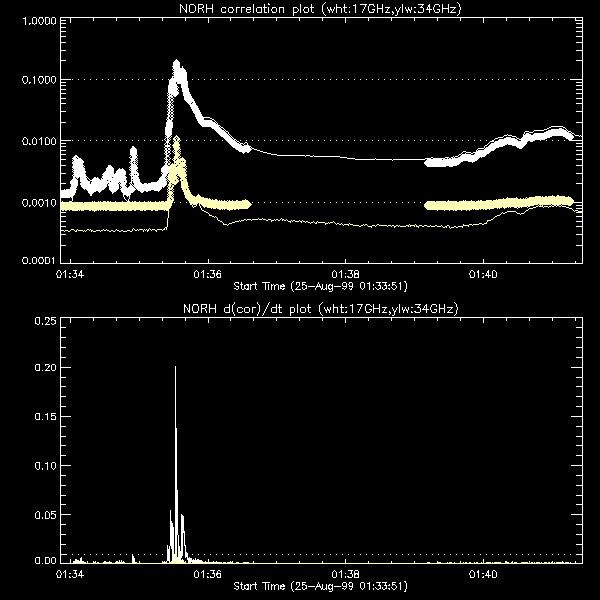
(top) NoRH 17/34 GHz correlation plot; Diamonds indicate the data points of event mode (50ms/100ms cadence):
(white line) 17 GHz
(yellow line) 34 GHz .
(bottom) Temporal derivative of correlation plot. Unit is (s^-1). Dotted line indicate 1 %/sec boundary.
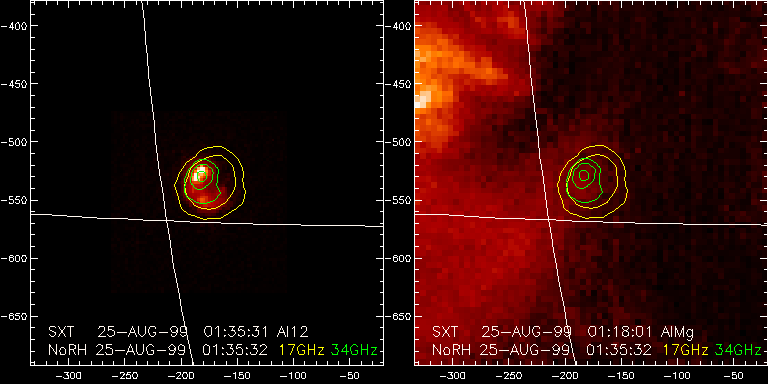
SXT image overlaid with NoRH contours.
(green/blue) NoRH 17/34GHz brightness temperatures
in logarithmic scale.
Field of View is the same as Partial Image above
Contour levels
are log10(Tb) = 5,6,7,8,...
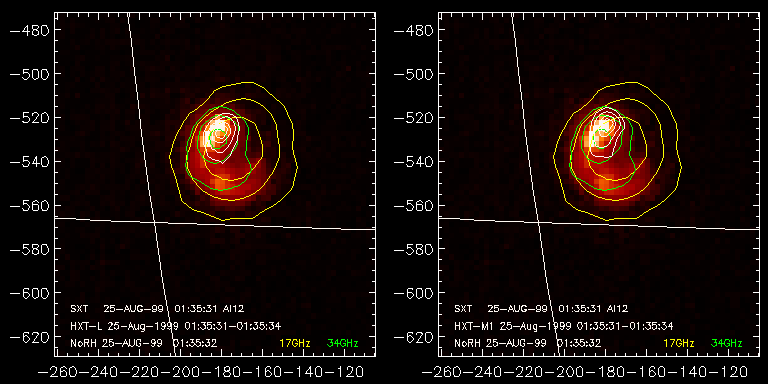
HXT image overlaid with NoRH contours.
(green/blue) NoRH 17/34GHz brightness temperatures
in logarithmic scale.
Field of View is the same as Partial Image above
Contour levels
are log10(Tb) = 5,6,7,8,...