Note :
From 03:25 UT to 03:45 UT, the quality  of synthesized 17 GHz images
is extremely low probably because of the too strong intensity.
So no images for 17 GHz is in the archive in this duration.
The 34GHz images are OK.
EventID : 20010403_0336
Keyword : Flare
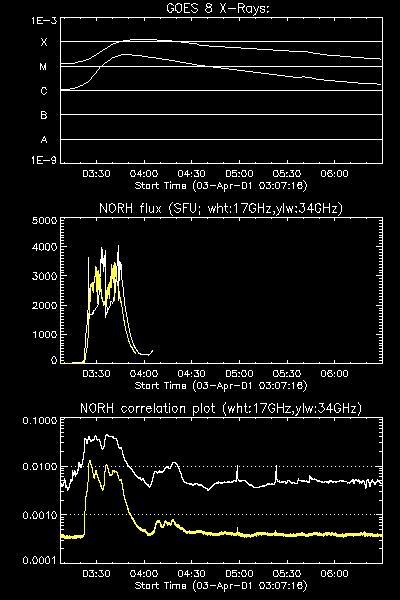
Start : 2001-04-03T03:07:16.000Z
Peak : 2001-04-03T03:36:18.000Z
End : 2001-04-03T06:29:57.000Z
Position: S19E89
X (arcsec) : -913
Y (arcsec) : -329
Maximum Correlation @17GHz (x10^-4) : 451
Maximum Brightness Temperature @17GHz : 1.4e+08
Area_src/Area_beam @17GHz : 0.0
Maximum flux @17GHz (SFU) : 0
Maximum flux @34GHz (SFU) : 0
Number of Impulsive fluctuation : 0
GOES: X1.2
NOAA Number: 9415
Yohkoh HXT (L,M1,M2,H): (635,116,43,33)
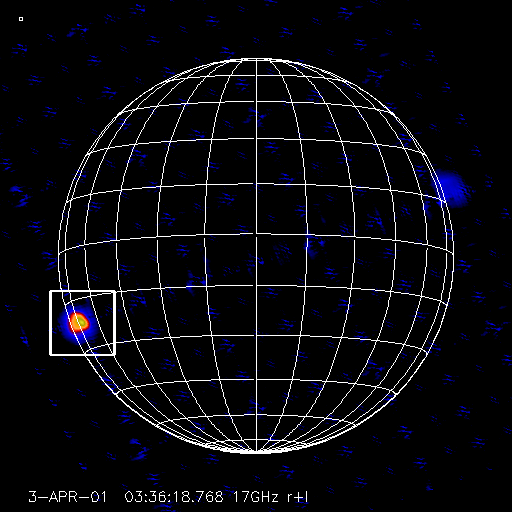
Full sun 17GHz image. The flare region is indicated by the solid box.
movie
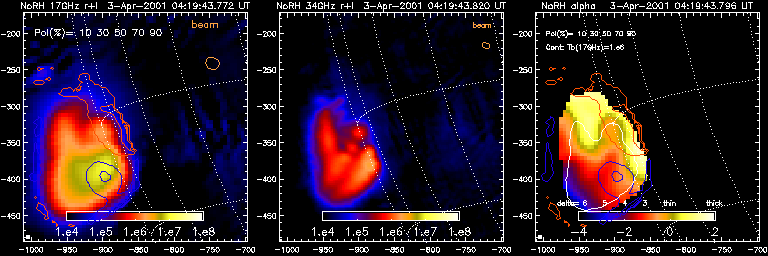
Partial 17/34GHz images. Color map shows brightness temperature,
contour shows 17GHz (r-l)/(r+l) levels,
where 'r' and 'l' indicates right- and
left-handed circularly-polarized components, respectively.
Field of View is 314. x 314. arcsec
Contour levels
of the thick lines are (r-l)/(r+l)=-0.1,-0.2,..
and those of the thin lines are (r-l)/(r+l)= +0.1,+0.2,...
Orange circle at top-left indicates the half-max. beam size