EventID : 20041104_2305
Keyword : Flare
Start : 2004-11-04T22:44:59.000
Peak : 2004-11-04T23:05:19.000
End : 2004-11-05T01:30:24.000
Position: N07E16
X (arcsec) : -280
Y (arcsec) : 69
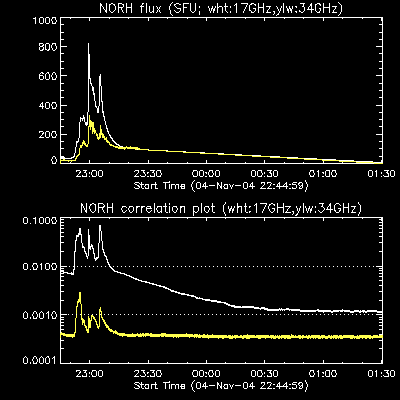
Maximum Correlation @17GHz (x10^-4) : 697
Maximum Brightness Temperature @17GHz : 9.8e+06
Area_src/Area_beam @17GHz : 8.3
Maximum flux @17GHz (SFU) : 614
Maximum flux @34GHz (SFU) : 228
Number of Impulsive fluctuation : 0
GOES: M5.4
NOAA Number: 696
RHESSI Energy (keV): 12-25
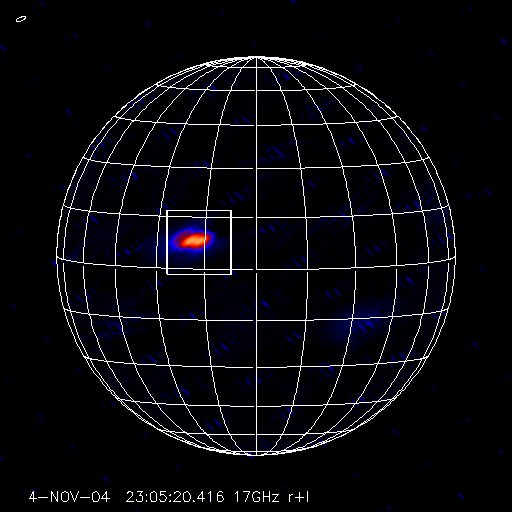
Full sun 17GHz image. The flare region is indicated by the solid box.
movie
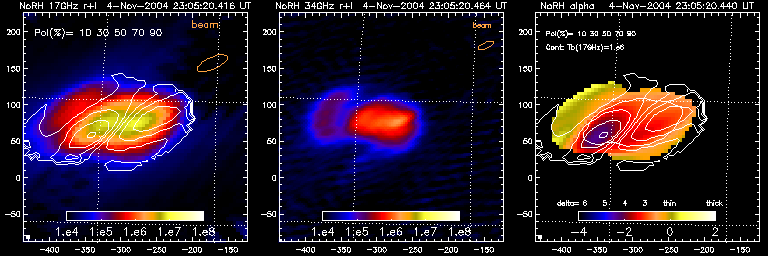
Partial 17/34GHz images. Color map shows brightness temperature,
contour shows 17GHz (r-l)/(r+l) levels,
where 'r' and 'l' indicates right- and
left-handed circularly-polarized components, respectively.
Field of View is 314. x 314. arcsec
Contour levels
of the thick lines are (r-l)/(r+l)=-0.1,-0.2,..
and those of the thin lines are (r-l)/(r+l)= +0.1,+0.2,...
Orange circle at top-left indicates the half-max. beam size