EventID : 20040722_0138
Keyword : Flare
Start : 2004-07-22T01:33:18.000
Peak : 2004-07-22T01:38:46.000
End : 2004-07-22T01:48:29.000
Position: N06E15
X (arcsec) : -260
Y (arcsec) : 29
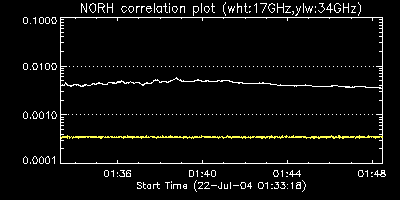
Maximum Correlation @17GHz (x10^-4) : 57
Maximum Brightness Temperature @17GHz : 2.2e+06
Area_src/Area_beam @17GHz : -1.3
Maximum flux @17GHz (SFU) : -4
Maximum flux @34GHz (SFU) : -3
Number of Impulsive fluctuation : 0
GOES:
NOAA Number:
RHESSI Energy (keV): ---
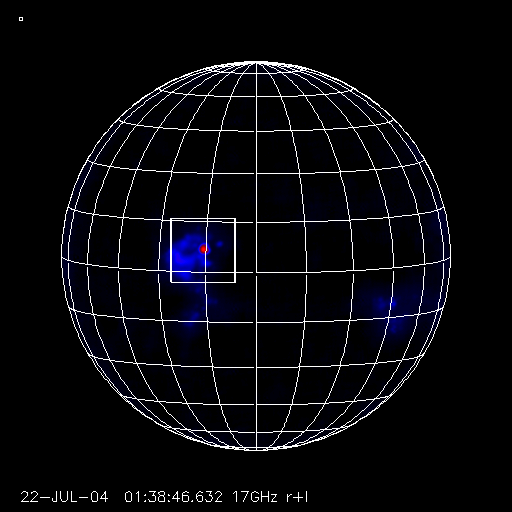
Full sun 17GHz image. The flare region is indicated by the solid box.
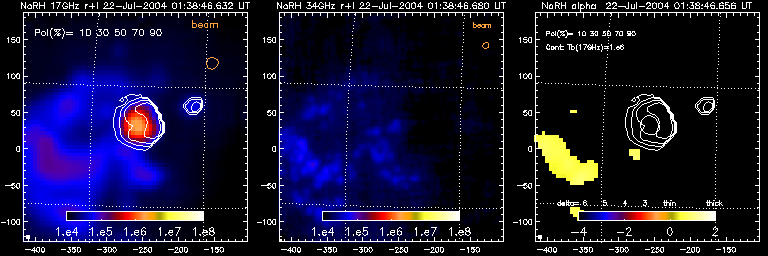
Partial 17/34GHz images. Color map shows brightness temperature,
contour shows 17GHz (r-l)/(r+l) levels,
where 'r' and 'l' indicates right- and
left-handed circularly-polarized components, respectively.
Field of View is 314. x 314. arcsec
Contour levels
of the thick lines are (r-l)/(r+l)=-0.1,-0.2,..
and those of the thin lines are (r-l)/(r+l)= +0.1,+0.2,...
Orange circle at top-left indicates the half-max. beam size