


: Optically-Thin Non-Thermal Gyrosynchrotron Emission
: Analysis
: Plot
Spectrum Analysis
By coordinating multiple frequency observation, we may dervive the
spectrum of the emission. The obtained variable is  whose
definition is
whose
definition is
In real, is not uniform over the frequencies.
But the spectrum in microwave range is approximately fitted by the fucntion
in the form :
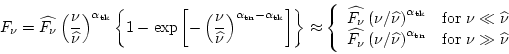 |
(1) |
Here are 4 fitting parameters:  is turn-over frequency,
 is turn-over flux density,
 is power index of low frequency side (optically thick side)
and
is power index of low frequency side (optically thick side)
and
 is power index of high frequency side (optically thin side),
respectively. The procedures are as follows:
IDL> day='2000-4-8'
is power index of high frequency side (optically thin side),
respectively. The procedures are as follows:
IDL> day='2000-4-8'
IDL> norp_rd_dat,day,mvd,tim,fi,fv,freq  CR
CR
IDL> norp_rd_avg,day,timavg,fiavg,fvavg CR
IDL> for m=0,6 do fi(m,*)=fi(m,*)-fiavg(m) CR
IDL> norp_alpha,freq,fi,mvd,mvdfit,alpha_tk,alpha_tn,freqpk,fluxpk
CR
After subtracting the pre-flare flux levels (here daily averages are used),
the flare fluxes are given to the IDL procedure norp_alpha.
mvdfit is an array including the values of unity (1) for
valid data or zero (0) for non-valid data.
Note: The fitting will usually fail in the simple manner shown here.
We need (1) to take longer intergation time for getting better S/N ratio and
(2) to remove the inadequate data for fitting (because, say, the emission
in that frequency is not due to gyrosynchrotron). See
3.8.3 for better procedures.
: Optically-Thin Non-Thermal Gyrosynchrotron Emission
: Analysis
: Plot
Takaaki YOKOYAMA
�$BJ?@.�(B12�$BG/�(B10�$B7n�(B25�$BF|�(B