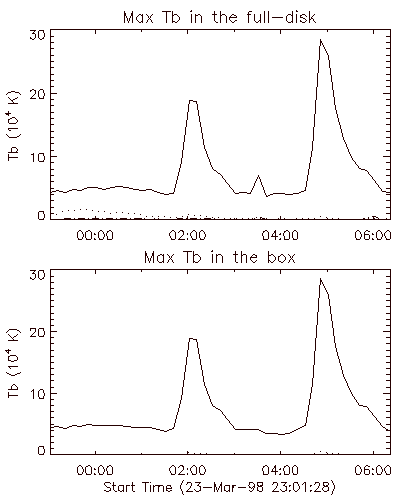
Time evolution of the maximum Tb in the full-disk (upper) and in the box (lower),
The solid line shows Max (R+L) and the dotted line shows Max (R-L).
Data points are plotted every 10 min.
EventID : 19980324_0148
Keyword : flare
Observer : KH
Start : 1998-03-24 01:47:28
Peak : 1998-03-24 01:48:17
End : 1998-03-24 01:49:52
Position: S30W84
Maximum Correlation @17GHz (x10^-4) : 54
Maximum Brightness Temperature @17GHz : 1.3e4
GOES: C2.3
NOAA Number: --
EventID : 19980324_0442
Keyword : flare
Start : 1998-03-24 04:42:19
Peak : 1998-03-24 04:42:59
End : 1998-03-24 05:09:38
Position: S30W84
Maximum Correlation @17GHz (x10^-4) : 15
Maximum Brightness Temperature @17GHz : 1.3e4
GOES: C4.3
NOAA Number: --
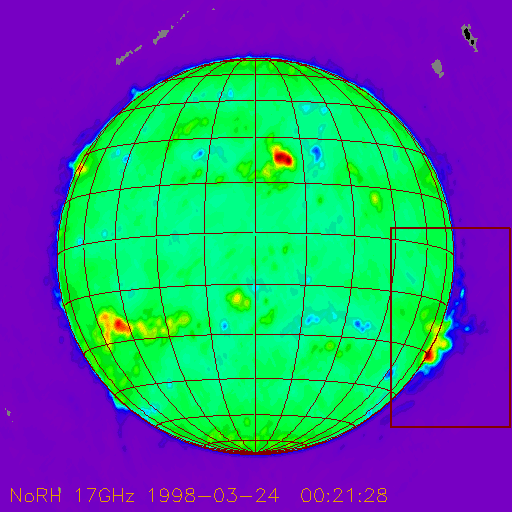

Time evolution of the maximum Tb in the full-disk (upper) and in the box (lower),
The solid line shows Max (R+L) and the dotted line shows Max (R-L).
Data points are plotted every 10 min.
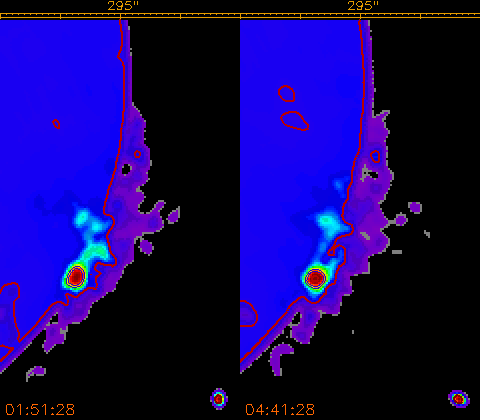
Stokes I (R+L) map in the box taken during the two flares.
The brightness is normalized to the Max Tb in each image.
Mpeg movie (10 min. interval)
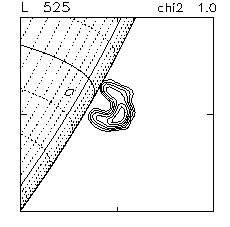
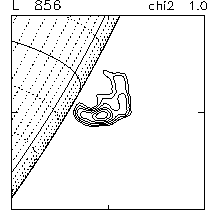
Hard X-ray sources of the two flares.
Yohkoh/HXT L-channel images synthesized at 01:47-01:48UT (left)
and at 04:42-04:43UT (right).