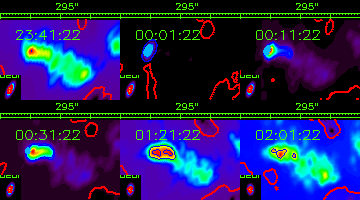
Partial images in the box (R+L map). Blue contour lines represent where Tb is 1.e3 and 1.e4 (K),
while light blue lines where Tb of STOKES(L-R) is larger than 1.e4 (K).
EventID : 19990216_0001
Observer : K.Hori
Keyword : Flare
Start : 1999-02-15 23:59:59
Peak : 1999-02-16 00:01:38
End : 1999-02-16 00:37:18
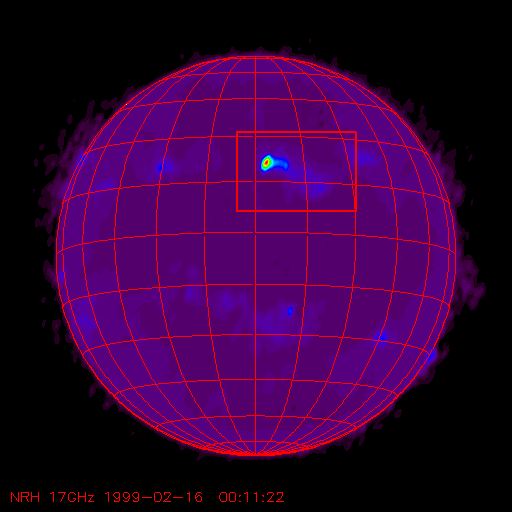
Position: N20W03
Maximum Correlation @17GHz (x10^-4) : 818
GOES: M1.2
NOAA Number: 8462

17GHz Mpeg movie of the box region.

Partial images in the box (R+L map).
Blue contour lines represent where Tb is 1.e3 and 1.e4 (K),
while light blue lines where Tb of STOKES(L-R) is larger than 1.e4 (K).

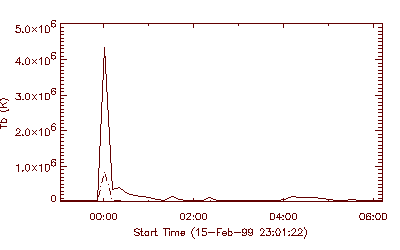
Time evolution of the maximum brightness temperature at 17GHz in the box.
Solid line represents Max(R+V), while dash-dotted line Max(L-R).
Data points are plotted every 10 min.
