Nobeyama Radioheliograph
Event 19980423_0541
EventID : norh19980423_0541
Observer : J. Sato and T. Yokoyama
Keyword : flare
Start : 1998-04-23 05:36:18
End : 1998-04-23 06:44:56#
Peak : 1998-04-23 05:41:39
Maximum Correlation @17GHz (x10^-4) : 2128
Position : S13E91 or S18E91(SXT PFI center)
GOES : X1.2
NOAA Number : 8210
This event is important !!
1) Full data set taken with the NORH,
SXT, HXT. Especially NORH 100 msec data was obtained,
2) Strong brightness in radio map means
non-thermal emission.
3) Number of SXT quarter images is
large due to special table plan (thanks to SXT chief observers).
Study of coronal structure in flare is possible.
4) Due to limb occulting, detailed
study of loop top structure is possible.
5) One of few example of LDEs which are
synthesized in YOHKOH HXT.
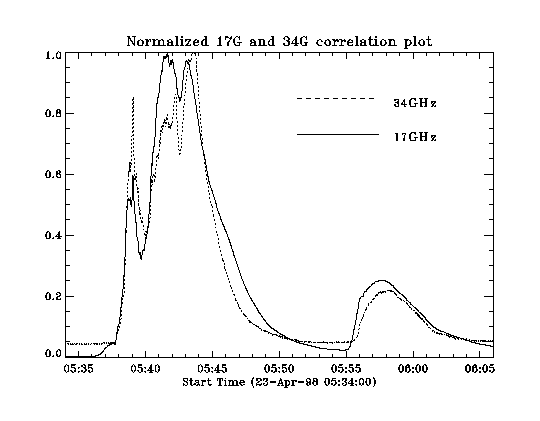
NRO 17/34 GHz correlation plot
Rapid increase of 17
GHz correlation data means that 17 GHz source appeared
transiently. It corresponds that radio foot point sources may be
occulted. If so, many images at many spikes may give us detailed
understanding of energy release or acceleration site.
NRO Polarimeter Data (9.4 GHz data should be corrected)
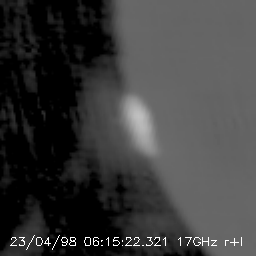
17GHz Radio Map movie
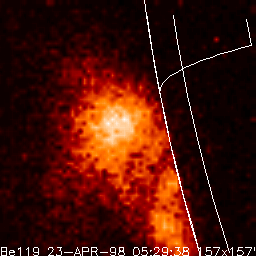
 SXT PFI(quarter)
movie
SXT PFI(quarter)
movie
SXT images show
continuous evolution of loops during preflare and impulsive phase
in north region. Flareing region is south. Brightest part can be
seen near the limb and its height is lower than expanding loops.
Obvious footpoint brightnigng or elongated loop structure could
not be seen in begining of the flare. Therefore, limb may be
occulted.
 SXT PFI(Full)
movie
SXT PFI(Full)
movie
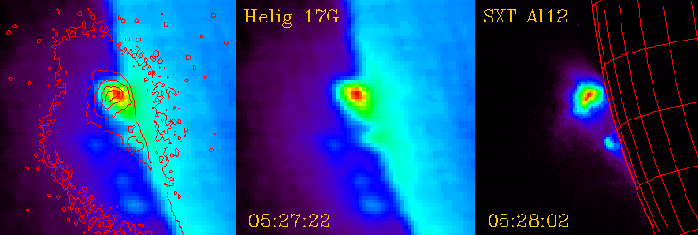
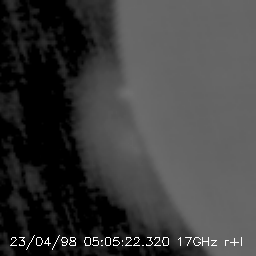
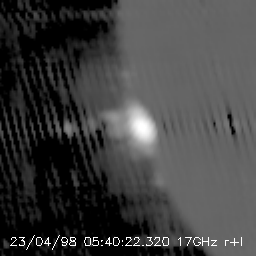
Coaligned NORH and SXT images before
impulsive phase. Left: SXT(contour) and NORH(17GHz). Middle:
NORH(17GHz). Right: SXT (Al12). Brightest region is not flaring
region. In the NORH, faint coronal structure (south) shows curious
structure such like blobs.
movie
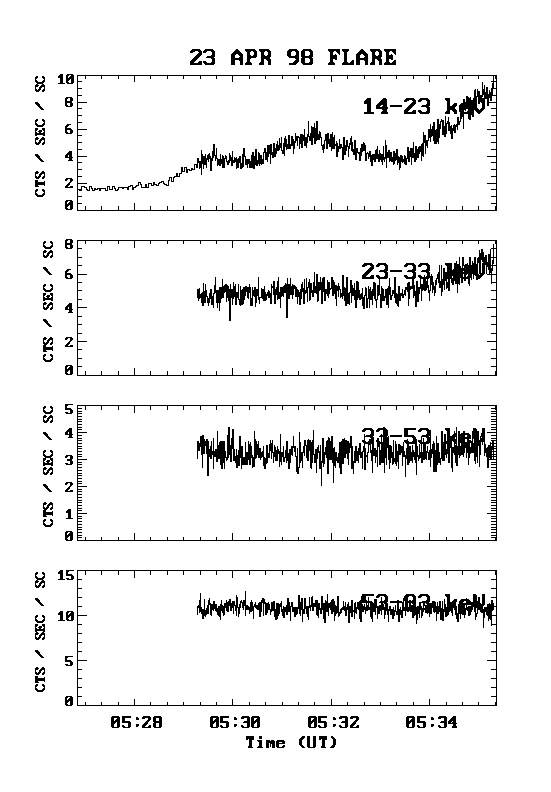
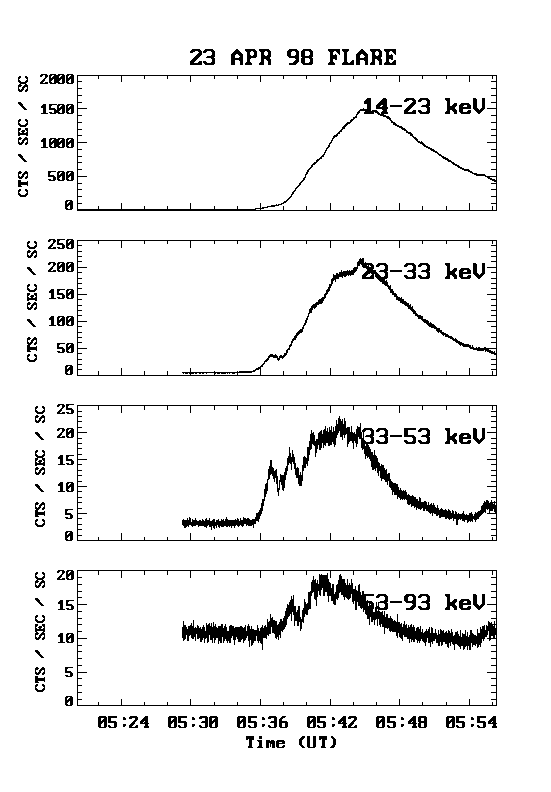
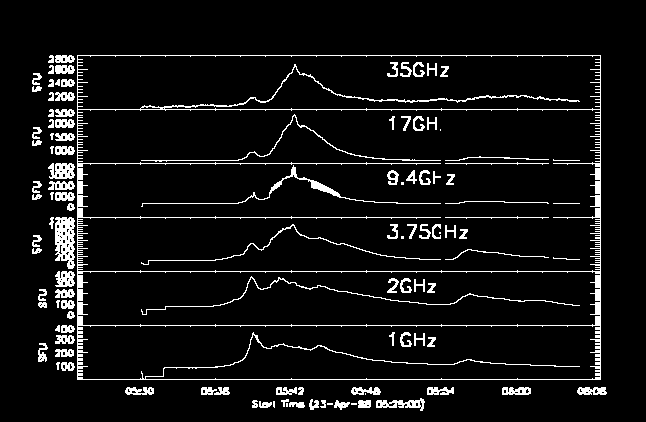
HXT 4 channel plot
HXR time profile shows gradual behavior
and its spectrum is soft. In the begining of flare, M1 band time
profile shows less spike structure compared with L band.
Moreover, its count is high than usual background counts (1-2
counts/SC) .
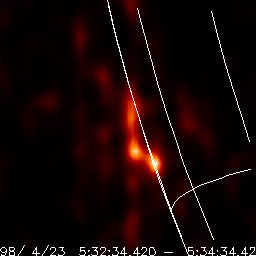 HXT L band Images ( 157X157^M
arcsec) movie (grid line is tentative)
HXT L band Images ( 157X157^M
arcsec) movie (grid line is tentative)
HXT L band source shows
obivious source motion from south to north direction.
Near the end of this flare, HXT L band
source shows two separated component. One exists in higher
corona.
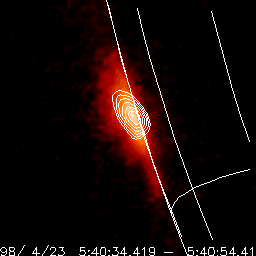

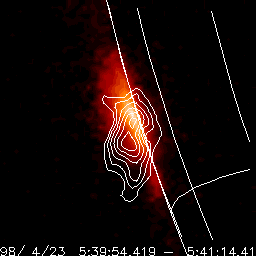
Coaligned SXT(color) and HXT(contour)
Images. Left: L band (5:40:34-5:40:54), Middle: M1 band
(05:40:34-05:40:54), Right: M2 band (05:39:54-05:41:14), SXT(be
filter) observation time is 05:40:36.
Last updated on April 27, 1998