EventID : 19981108_2255
Observer : NORH tohban
Keyword : Flare
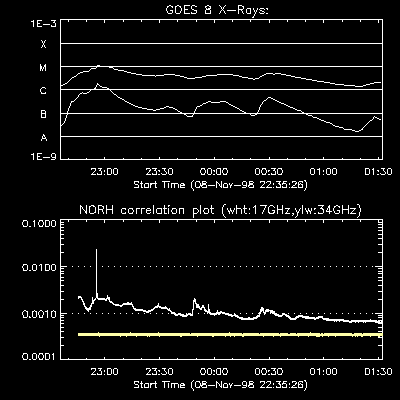
Start : 1998-11-08T22:45:22.000Z
Peak : 1998-11-08T22:55:18.000Z
End : 1998-11-09T00:13:35.000Z
Maximum Correlation @17GHz (x10^-4) : 237
Position: N20W57
GOES:
NOAA Number:
YohkohHXT (L,M1,M2,H): (,,,)
 movie
movie
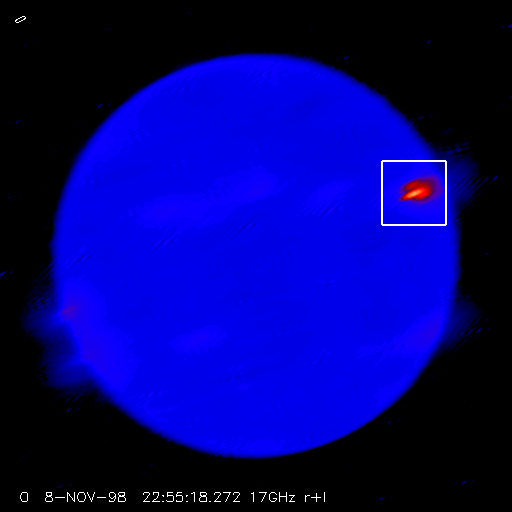
(left) Full sun 17GHz map. The flare region is indicated by the solid box.
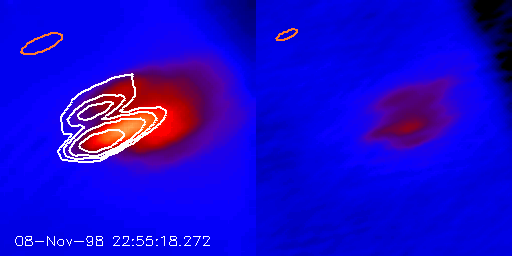
(right) Partial 17/34GHz image. Color map shows brightness temperature,
contour shows 17GHz (r-l)/(r+l) levels,
where 'r' and 'l' indicates right-hand and
left-hand polarity, respectively. Contour levels
of the thick lines are (r-l)/(r+l)=-0.1,-0.2,..
and those of the thin lines are (r-l)/(r+l)= +0.1,+0.2,...
Orange circle at top-left indicates the half-max. beam size