


: Interpretation of Data
: Example of Analysis Session
: Polarization Plot
�$BL\
Spectrum Distribution
�$B?^�(B 4:
Spectrum Distribution (gray scale),
 (contour of thick line),
and circular polarization degree (contour of thin line)
(contour of thick line),
and circular polarization degree (contour of thin line)
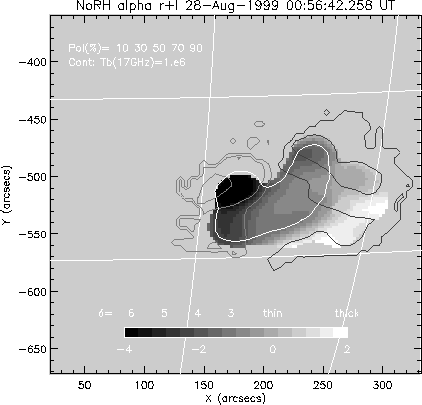 |
From a pair of 17GHz and 34GHz images,
spectrum distribution can be obtained.
It is used for judging the emission mechanism and/or
deriving the power-law index of non-thermal elecrons.
The derived variable is  whose definition is
Since available frequencies for NoRH are only two,
the actual derivation is
By using a pair of images of 17 GHz and 34 GHz with the same field of view
IDL> file='./ipa990828_005642'  CR
CR
IDL> norh_rd_img,file,indexa,dataa CR
IDL> file='./ipz990828_005642' CR
IDL> norh_rd_img,file,indexz,dataz CR
IDL> fi17=norh_tb2flux(dataa,indexa,/intensity) CR
IDL> fi34=norh_tb2flux(dataz,indexz,/intensity) CR
IDL> norh_convol,indexz,indexa,fi17,indexa_c,fi17_c CR
IDL> norh_convol,indexa,indexz,fi34,indexz_c,fi34_c CR
IDL> norh_alpha,indexa_c,fi17_c,indexz_c,fi34_c
,indexal,alpha,mvda CR
alpha is the power law index of spectrum .
mvda is an array including
the values of unity (1) for valid data or zero (0) for non-valid data.
indexal is an index correspoinding to data alpha.
For easy plot (Fig 4)
IDL> norh_plot_alpha,indexal,alpha,mvda,indexp,pol,mvdp,indexa,dataa
CR
For preparing to overplot with other instrumental data, change the
data format to SolarSoftware map.
IDL> norh_index2map,indexal,alpha*mvda,mapalpha CR
IDL> plot_map,mapalpha,dmin=-4,dmax=2 CR
: Interpretation of Data
: Example of Analysis Session
: Polarization Plot
�$BL\
Takaaki YOKOYAMA
�$BJ?@.�(B12�$BG/�(B10�$B7n�(B25�$BF|�(B